
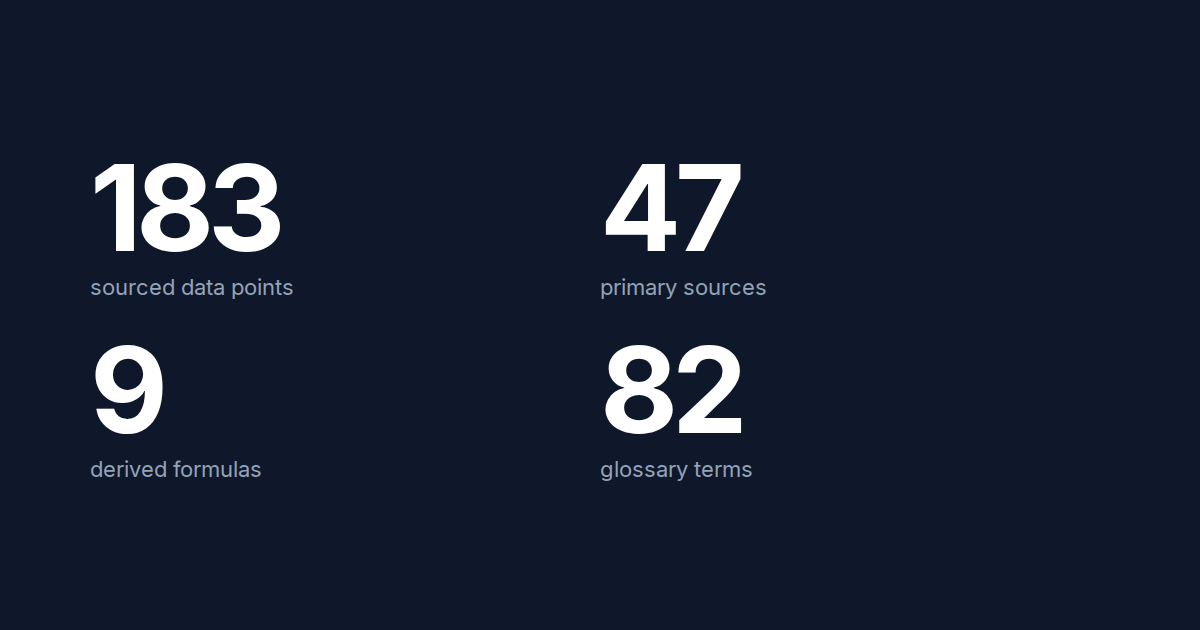
Three reference pages sit outside the chronological feed and are maintained rather than dated: two statistics hubs and one glossary. This post documents how they are built so a reader knows what a number on them means and how far it can be trusted.
The two hubs
| Hub | Sections | Data points | Sources | Updated |
|---|---|---|---|---|
| AI agent statistics | adoption · ROI · developers · capability · reliability · workforce | 92 | 21 | 2026-09-13 |
| AI coding tool statistics | adoption · productivity · quality · benchmarks · agents · workforce | 91 | 26 | 2026-09-13 |
Every figure links to a numbered source entry that records the publisher, the report name, and the date. The date is the measurement or publication date of the source, not the date the hub was updated — a survey fielded in mid-2025 stays labelled 2025 however recently the page was refreshed.
What a number on a hub is, and is not
The hubs deliberately place three kinds of evidence on the same page. They do not measure the same thing.
- "84% use or plan to use AI tools"
- population + fielding date matter
- self-report bias
- "+19% task time in an RCT"
- sample and task set matter
- narrow generalisation
- "61.5% on SWE-bench Pro"
- dataset version + harness matter
- contamination risk
A survey figure and a benchmark figure that appear to conflict usually do not; they answer different questions. The hubs keep them in separate sections and label the source type so the reader can tell which is which.
The derived formulas
Each hub carries a Formulas section with quantities computed from the cited figures rather than quoted from a source. They exist so the numbers can be reasoned with. Three examples, with their inputs:
Perception gap (coding tools hub). METR’s randomised trial measured experienced developers at task time with AI while they estimated :
Reliability under repetition (agents hub). If a single task succeeds with probability per independent run, the probability that it succeeds on all runs decays geometrically; across a benchmark the metric is the average of those per-task values, not the aggregate pass rate raised to . τ-bench reports for exactly this reason: a system that passes a task about half the time is much less than half as reliable when the same task must succeed eight times in a row.
Review load multiplier (coding tools hub). Faros telemetry shows high-AI teams merging 98% more pull requests, each 154% larger:
Each formula card names the assumption that limits it — for the review multiplier, that both effects apply to the same teams; for , that runs of the same task are independent.
The glossary
The glossary has 82 term pages generated from two topic sets: 41 agent terms and 49 coding-tool terms. Eight slugs appear in both sets — context window, MCP, coding agent, SWE-bench, benchmark saturation and three more — and resolve to one URL and one definition, with the page listing both topic-set memberships, rather than to two competing entries.
Each term page carries a one-sentence definition, a longer explanation, and links back to the statistics that use the term. The sentence definition is the canonical one; the statistics hubs and the comparison pages use terms in that sense.
Citing
The hubs publish under CC BY 4.0 with a BibTeX entry at the foot of each page, and expose the source table as structured data. Cite the primary source for the figure and the hub for the compilation; a hub number without its source is a secondary citation.
For a worked example of attaching methodology to a single headline figure, see the Terminal-Bench 2.1 methodology.